Most GOTV programs stop measuring at page views. Learn the two-ask framework (registration checks + voting plans) that produces verified turnout data, plus why a January voter file match-back is the step that actually proves your program worked.
A voter on your list gets an email that says don't forget to vote, and it sends them to their Secretary of State's page to find a polling location. You know how many people clicked. That's the whole report.
Your get-out-the-vote (GOTV) page picked up traffic during the runup to the election too. A view tells you someone landed there. It doesn't tell you what they did next, and it doesn't tell you whether they voted. Everything a board actually wants to know sits below that click: who confirmed their registration, who told you how they planned to vote, and in January, who from your list actually showed up.
I've run this program enough times to know where it usually gets built, and where it usually stops getting measured. Those are two different places, and the gap between them is where most of a program's actual value disappears. Below is a two-ask setup you can run through the fall, plus the January step that turns it into a real turnout number.
What a measurable GOTV program produces
A measurable program produces two different things, at two different points in the calendar, and mixing them up is the most common mistake I see.
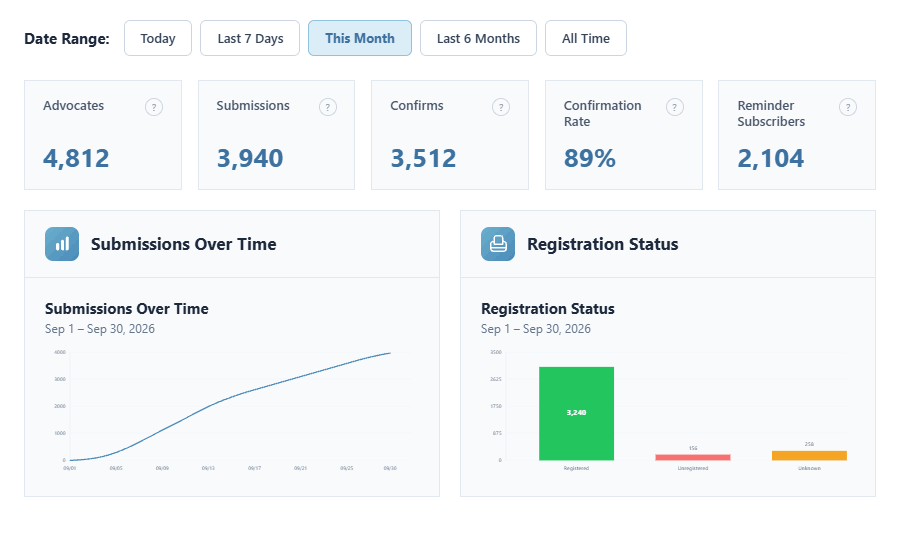
During the program, it's the number of people who took a verified, logged action: registrations checked, voting plans made through the two asks below, each one attached to a supporter record.
After the program, it's verified turnout: the percentage of your list that voted in November, and the percentage among the people you specifically engaged. That second number is the one the entire program exists to produce.
This is also where the research on what actually moves turnout starts to matter.
A standard "don't forget to vote" reminder, the plain nudge most GOTV emails default to, showed no significant effect on turnout in a 287,000-person field experiment. Asking the same people to make a voting plan, covering how, when, and where they'd vote, moved turnout 4.1 percentage points, and 9.1 points in single-voter households (Nickerson & Rogers, Psychological Science, 2010).
A plain reminder is the easiest message to write and the hardest to prove did anything. A voting plan is a slightly bigger ask, and it's the one with a measurable result behind it.
The January problem
Most organizations know they can check who from their list actually voted. The timing has been against them.
Most organizations know that they can check and see who from their program voted, but they don't because the records aren't available until January, when boards of election finish updating. By then, campaign season is over and organizations are focusing on other things. The election and voting tools they subscribe to are gone. Meanwhile, advocacy organizations are gearing up in January to mobilize those same people. That's why GOTV has always belonged in an advocacy platform and why we built it.
I've watched this exact sequence play out most cycles. Boards of elections typically finish updating their voter files in January, weeks after the campaign infrastructure built for the election has already been packed up. The tools rented for the fall aren't renewed. The team that ran the program has moved on to the next thing. The one month when the data becomes available is the same month everyone stopped looking for it.
For advocacy organizations, January works differently. It's when the next push starts. The people that program mobilized in November are the same people who need to hear from you about the session ahead, which is why the timing overlap matters: everything you gather in the fall is what gets matched against the voter file once it updates.
Ask 1 - Are you registered and ready to vote?
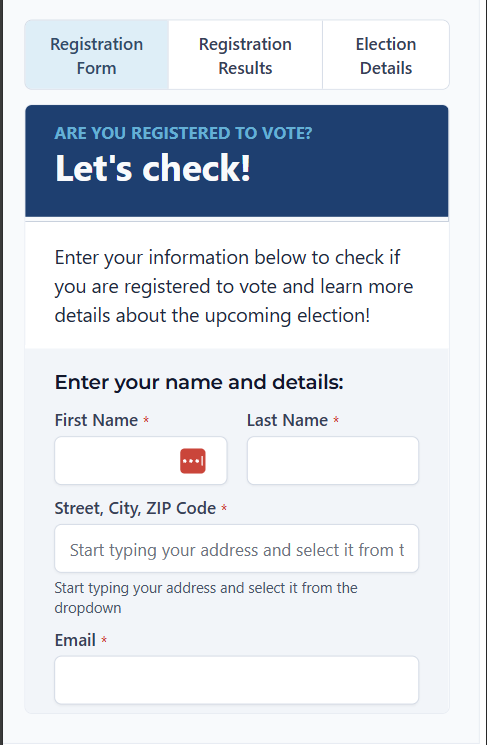
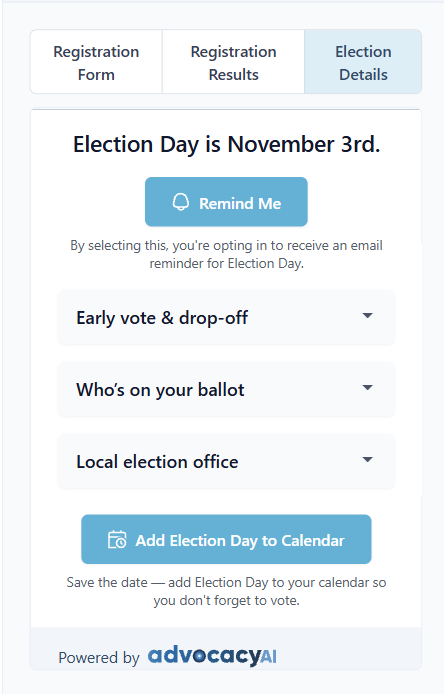
The mechanism is straightforward: put a registration checker on your own site, either as a widget or a simple landing page, rather than sending people somewhere else to check. Plenty of pro-voting organizations and tools offer registration checkers you can link out to. The important part is: Keep it somewhere where you can control your own data. If your advocacy platform has voter registration built in (AdvocacyAI does), the check happens on your page, and every result attaches directly to a supporter record.
What that gives you is two groups worth tracking separately: the people who confirmed they're registered, and the people who found out they weren't (moved, purged, never registered in the first place) and fixed it because you asked. That second group is a registration your program caused. Very few organizations can point to a number like with their own data.
Ask 2 — The Voting Plan
Frame the second ask as an offer: tell us how you're planning to vote (by mail, early, or on election day) and we'll send the reminder that matches. Then follow through. Someone who says they're voting by mail should get a mail-ballot timeline, timed to when ballots go out and when they need to be returned.
Segment by the answer. Mail voters get ballot-tracking and return-deadline reminders. Early voters get site and hours information timed to when early voting opens locally. Election-day voters get the standard reminder, polling location and hours, closer to November. Anyone who didn't answer gets a general version that covers all three.
Answering also tells the supporter that their plan matters enough to build a message around, and it puts your organization on record as checking in.
The ask that produces your best data is the same ask the research says most increases turnout. That combination is rare, and it's why the voting plan sits at the center of this program.
The rest is easy: Get it in front of people.
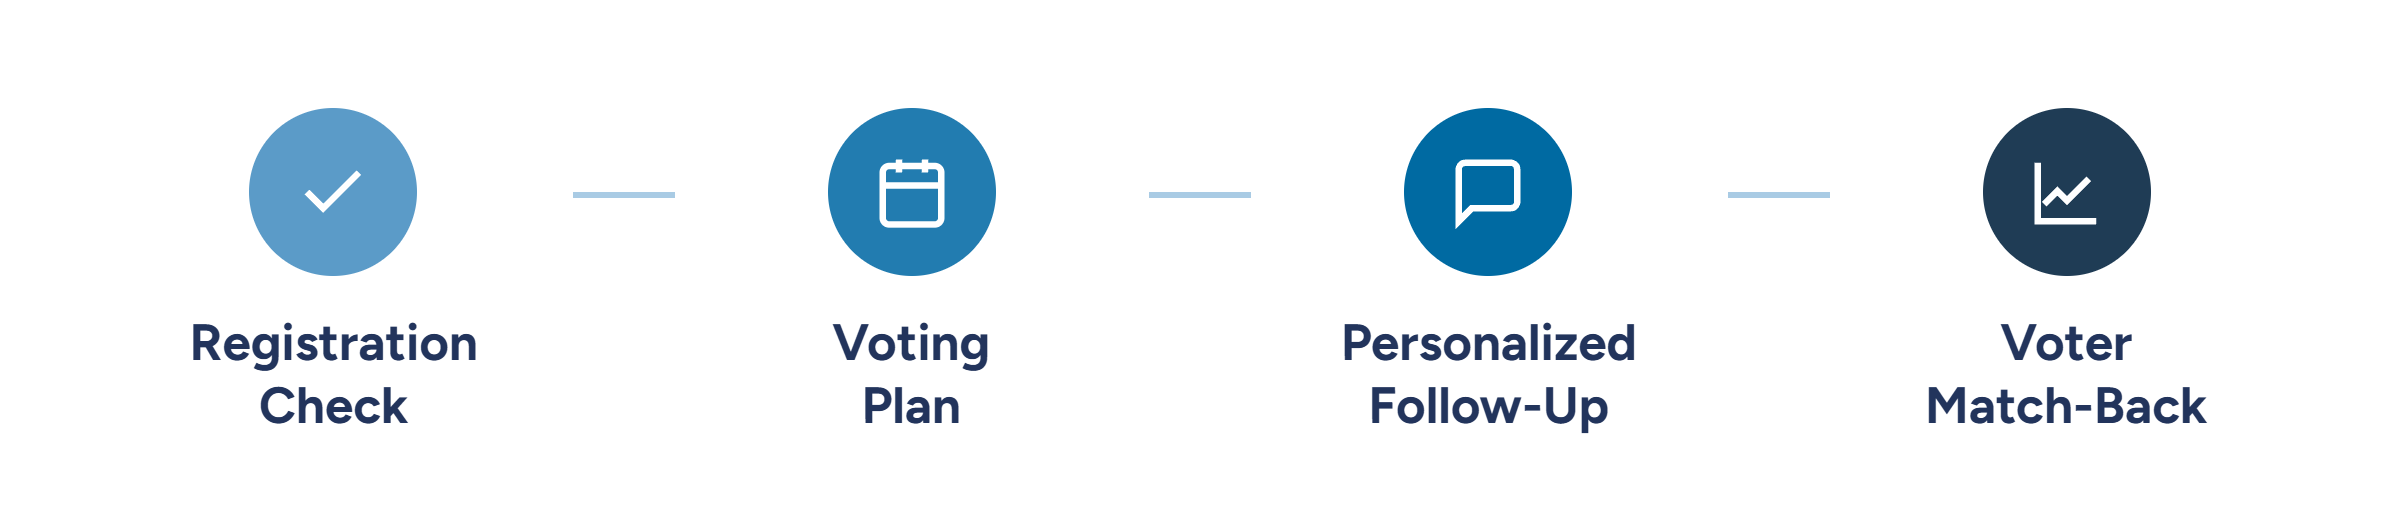
Two asks, placed at the moments they matter. That's it. Everything past that point is how you follow up with them according to the information they gave you. You're offering a service people find useful. That is what the most effective GOTV program does.
You'll know whether the registration checks came from the email or the social post, and whether the voting-plan responses came in from a text reminder or a paid ad. And then...
January — the match-back
Once boards of elections finish updating, typically in January, the state's voter file reflects who voted in November. A match-back is the process of comparing your list against that file to see who's on both. Three steps make up the whole process:
Wait for the state's voter file to update, typically in January. Match your engaged list (everyone tagged through a registration check or a voting plan) against that file.
Read out the number and percentage of your list verified as having voted, plus the same figure for the smaller group your program specifically engaged.
The traditional version of this is a commissioned data project: money, several weeks of turnaround, run by an outside vendor who matches your list against the state file and sends back a report. Most advocacy organizations skip it, because January belongs to the legislative session and nobody has weeks to wait on a vendor.
With a native voter file, the same question becomes a query you type into your platform's audience insights, the same way you'd pull an audience in a voter contact tool like NGP VAN or EveryAction.
With the native voter-file match in AdvocacyAI, you'll exactly who from your list voted. Even more importantly, you'll see how the interactions they had with your two asks impacted those votes. From a 30,000 foot view of your program AND individual voter profiles you can trace.
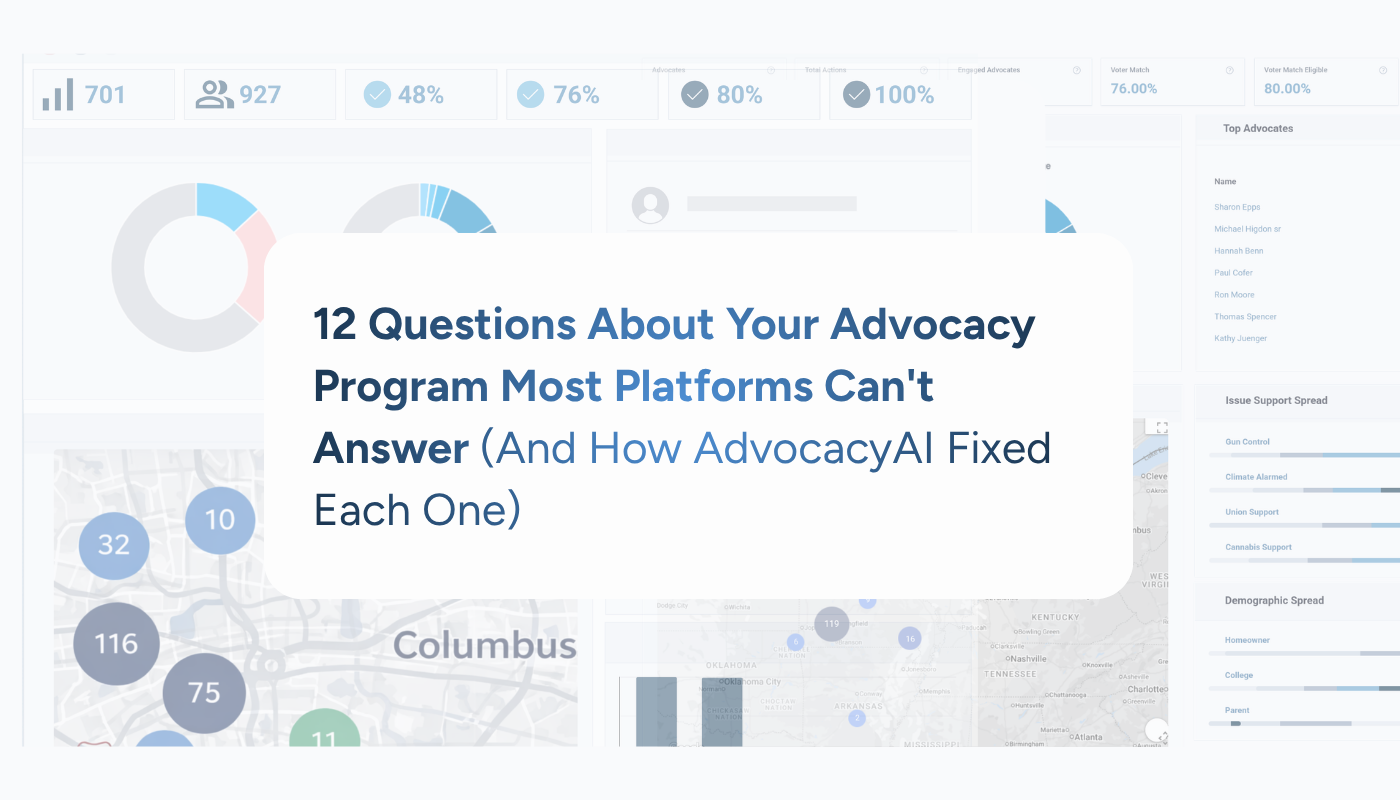
If you want the fuller picture of what a program like this can show you after the fact, 12 Things Advocacy Teams Can't Measure covers the gaps worth knowing about.
What to benchmark against
National turnout gives you a rough sense of scale: 46% in the 2022 midterm, 66% in the 2020 presidential election, according to the U.S. Elections Project. Expectations should move with the type of cycle. A midterm and a presidential year aren't playing against the same baseline.
The more useful number is your own list's prior-cycle turnout, which your first match-back establishes. A national average tells you what happened across the electorate. Your own history tells you what your list actually does when you run a program like this one.
Year one of a measurable program gives you a baseline. Year two gives you a trend, the first real answer to whether what you changed made a difference.
Frequently Asked Questions
A measurable GOTV program produces two numbers. During the program, it's the count of verified actions: registrations checked, voting plans made. After the program, once the state's voter file updates in January, it's the percentage of your list confirmed to have voted, and the same figure for the smaller group you specifically engaged. That second number is the one that answers whether the program worked. Click counts, page views, and emails sent describe activity. None of them tell you whether anyone voted.
A match-back is the process of comparing your list of supporters against the state's official voter file to see who actually voted. Organizations typically run it in January, once boards of elections finish updating the file to reflect the prior November's election. The output is a verified turnout number: the percentage of your list, and any subgroup within it, confirmed to have voted. It's the step that turns activity you tracked during the program into a turnout number you can defend afterward.
Yes. Nonpartisan voter registration and turnout work is standard 501(c)(3) activity, as long as it doesn't support or oppose a candidate or party. Registration checks and voting-plan messaging are procedural by design: they ask about status and logistics, not about preference, which keeps them on safe ground for most organizations. The specifics of what to say and how to document it still matter, so use the compliance-noted templates in the Member GOTV Playbook rather than treating this answer as legal guidance.
There's no single target that applies across organizations. National turnout moves with the type of election, as the benchmark numbers above show, so a program judged against the wrong baseline will look better or worse than it actually is. A midterm year and a presidential year draw from a different pool of voters entirely. The more useful benchmark is your own list's turnout from the prior cycle, which your first match-back establishes. From there, the goal is straightforward: beat your own number next time.
Typically in January, once boards of elections finish updating the state's voter file to reflect the prior November's election. Before that, the file doesn't yet include the most recent election's results, so a match-back run any earlier won't return an accurate number. January is also when most GOTV tools and vendors from the fall are no longer under contract, which is why organizations with their own voter file access have an advantage: the check becomes a query instead of a new project to set up.
The program is two asks, gathered at the moments they matter, and a query in January. What it produces is a turnout percentage no click report can hand you: a number you can defend to a board, compare year over year, and use to decide what to run differently next time.
If you want to see the whole loop (registration checks on your own page, voting plans landing in your database, and January turnout as a query), we'll show you in one demo.